
Development time HTTP Network logs Support in ballerina VSCode plugin
Network logs is a useful tool for identifying issues/debugging for an integration developer.
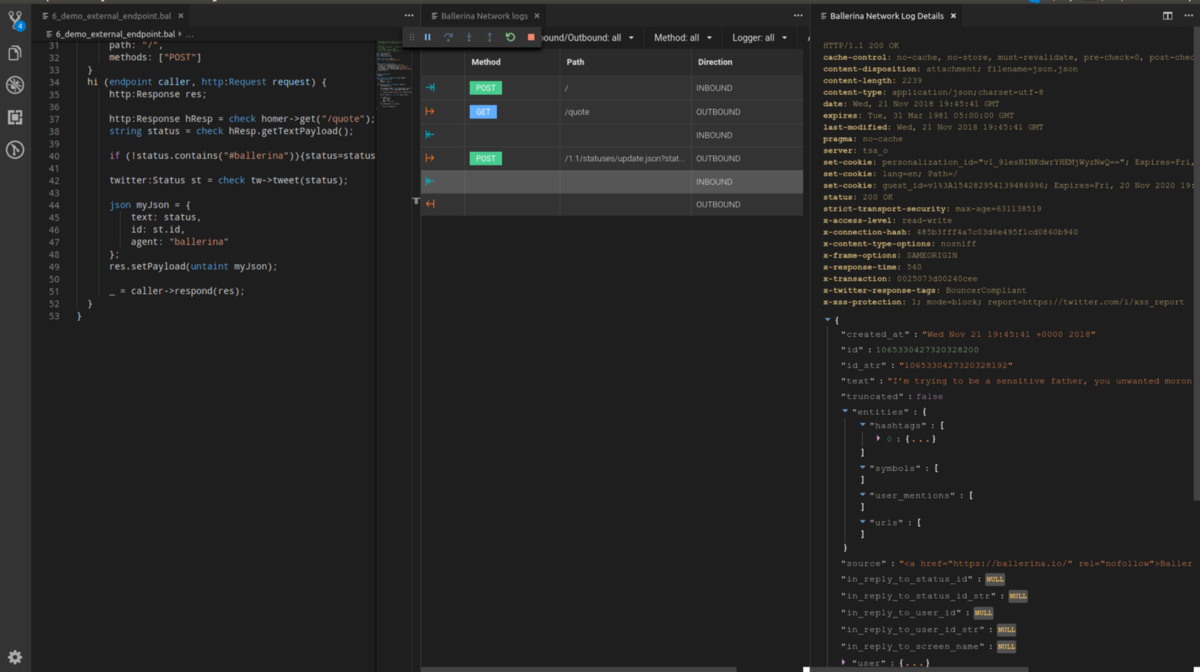
Each log line has a corresponding interaction arrow in the diagram and we use that to derive the icons for the loglines. And the icons will help you to distinguish inbound/ outbound and upstream/downstream messages easily.
Using network logs analyser in ballerina vscode plugin you can,
- See a list of all HTTP requests/responses with HTTP method, path, activity id and whether it’s inbound/outbound connection.
- You can filter the logs using the filter bar ( ex. Filter requests belong to a particular activity ID )
- See the complete message including payload and headers. If the request payload is JSON you will see a formatted message.
Got suggestions or feature requests? Add them here.
Written on February 4, 2019